Conditional Formatting – The basics
Quick start!
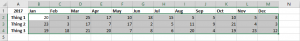
By applying conditional formatting to your data, you can quickly identify variances in a range of values with a quick glance.
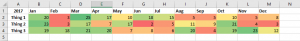
This is showing 3 items by number over a year. Red for the low scores, Green for the top scores.
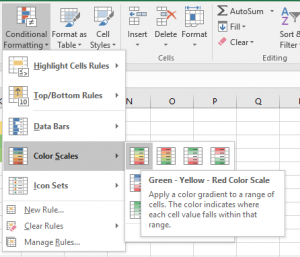
How To!
Select the data you want to apply it to
On the home tab, in styles is the Conditional Formatting icon. Select color scales